YouTube Analytics Can Be Confusing!
Here is how to use your numbers to make better videos….
A quick look at video analytics can tell you where to focus your energy and grow your channel to get thousands of new subscribers. Understanding what works and what doesn’t is essential to getting your channel to where you want it to be.
There are three key questions to answer for each video…
- Is my thumbnail & title reaching an audience
- Does my thumbnail & title entice viewers to click?
- When does your audience leave? Learn how to improve with the retention graph.
How many people browsing YouTube see your thumbnail & title? Go to your Channel Content in YouTube Studio and click on the Analytics for each video.

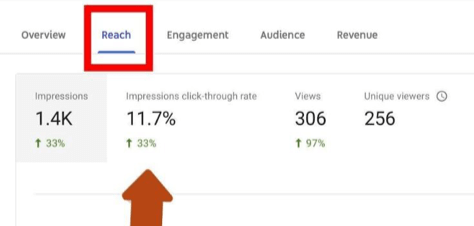
Once you are in the Video analytics, click on the Reach tab….

Here you can see how many people saw your video thumbnail (ie impressions).
If your number of impressions is low, there aren’t many people searching for that kind of video on YouTube. Perhaps try a slightly different take or topic.
If your video is getting impressions, take a look at the click-through rate. The average is 4-5%. If you are above average, nice work! If your click-through rate is in the low single digits, you need to work on the thumbnail and video title.
So if your video is getting impressions and a nice click-through rate… Congratulations! But don’t rest on your laurels, click over to the Overview tab and scroll down to see your Audience Retention graph.
What is the Audience Retention graph? It does what it says on the tin, this graph tells you the percentage of your viewers are watching at each second of your video. The Audience Retention graph is a powerful tool that tells you what content your audience want to see.

If your graph is flat until the end, your video is a winner. Fantastic! Keep doing what works. Make more content like this video.
If your graph goes down gradually, viewers are dropping off and losing interest. Rejigger your content. Tighten the video. Make it move faster to keep the viewers’ attention.
Pay attention to where your graph spikes! What happens at that timestamp? Make more content like that. Spikes appear when more viewers are watching, rewatching, or sharing a moment or moments of a video.
Cut out parts of your video where you see dips. Dips in your graph mean that viewers are skipping over those parts of your video
Make changes anywhere you see a sudden drop in the graph. A sudden drop means that viewers are leaving your video at that specific part.
By checking in on your analytics every now and then, you can see what is working and what is not. Building a successful channel is a process, and these stats are valuable feedback that will lead to better videos.